EXHIBIT 99.1
Published on April 15, 2026
Exhibit 99.1
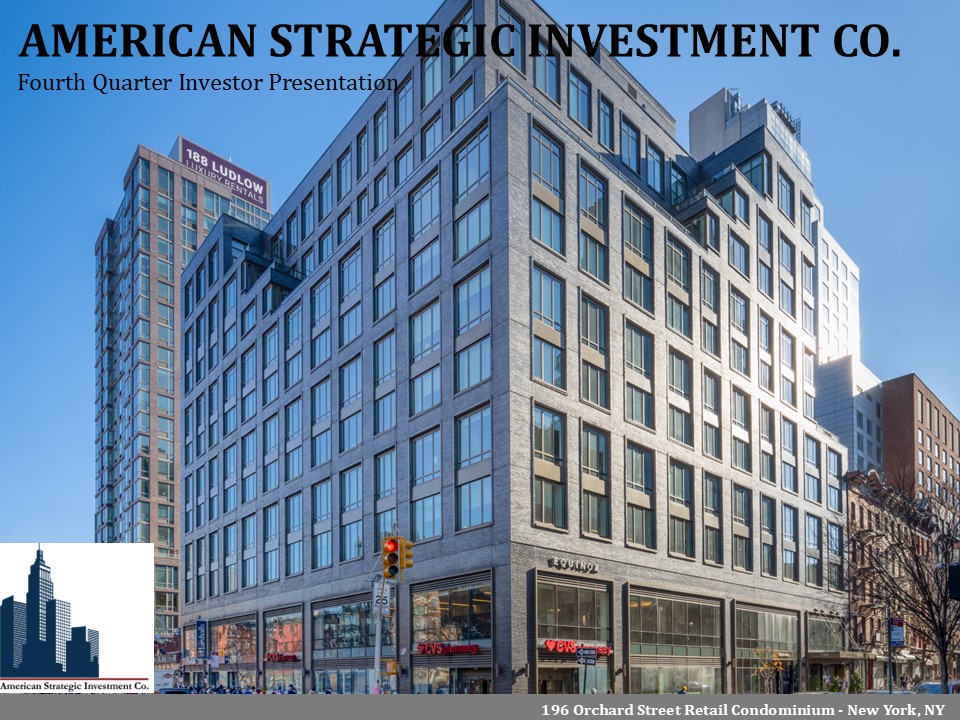
0 AMERICAN STRATEGIC INVESTMENT CO. Fourth Quarter Investor Presentation 196 Orchard Street Retail Condominium - New York, NY _
1 Fourth Quarter 2025 Highlights 1) See appendix for a full description of capitalized terms and Non - GAAP reconciliations. 2) Refer to slide 6 – Top 10 Tenant Investment Grade Profile. Based on Annualized Straight - line Rent and on ratings information as December 31, 2025. For our purposes, includes both actual investment grade ratings of the tenant or guarantor, if available, or implied investment grade ratings, which includes ratings of the tenant’s parent (regardless of whether the parent has guaranteed the tenant’s obligation under the lease) or lease guarantor. See appendix for a full definition of Investment Grad e. ASIC’s top 10 tenants are 43.6% actual Investment Grade (“IG”) rated and 25.4% implied Investment Grade. 3) Refer to slide 7 – Active Portfolio Management for additional information. 4) Refer to slide 9 – Capital Structure and Q4’25 Financial Results for further information regarding our capital structure and liquidity. 5) Based on Annualized Straight - Line Rent as of December 31, 2025. 6) Calculated as total mortgage notes payable, gross of $251.0 million minus cash and cash equivalents of $1.3 million (excludin g r estricted cash) divided by the carrying value of total assets of $445.2 million plus accumulated depreciation and amortizatio n o f $80.6 million as of December 31, 2025. 7) Data as of December 31 , 2025. 1 Manhattan focused real estate portfolio anchored by core commercial tenants and an attractive top 10 tenant base that is 69% Investment Grade (1)(2) x Portfolio Occupancy (1) of 80.3% with a weighted - average Remaining Lease Term (1) of 6.1 years x Solid tenant base featuring government agencies and Investment Grade corporate tenants with core commercial business x Well located core office properties in desirable sub - markets with close proximity to major transportation hubs x Top 10 tenants that are 69% (2) Investment Grade rated and have a Remaining Lease Term of 6.9 years x Well - balanced and long - term lease maturity schedule with over 57 % (5) of leases expiring after 2030 x 100% fixed - debt capital structure with a weighted - average interest rate of 4.5% x Net Leverage of 47.5% x No debt maturities until 2027 (6) x Advisor and affiliates own approximately 1.6 million (7) shares, demonstrating their commitment to the Company High Quality Manhattan Focused Portfolio Active Portfolio Management (3) Conservative Debt Profile and Advisor - Shareholder Alignment (4)
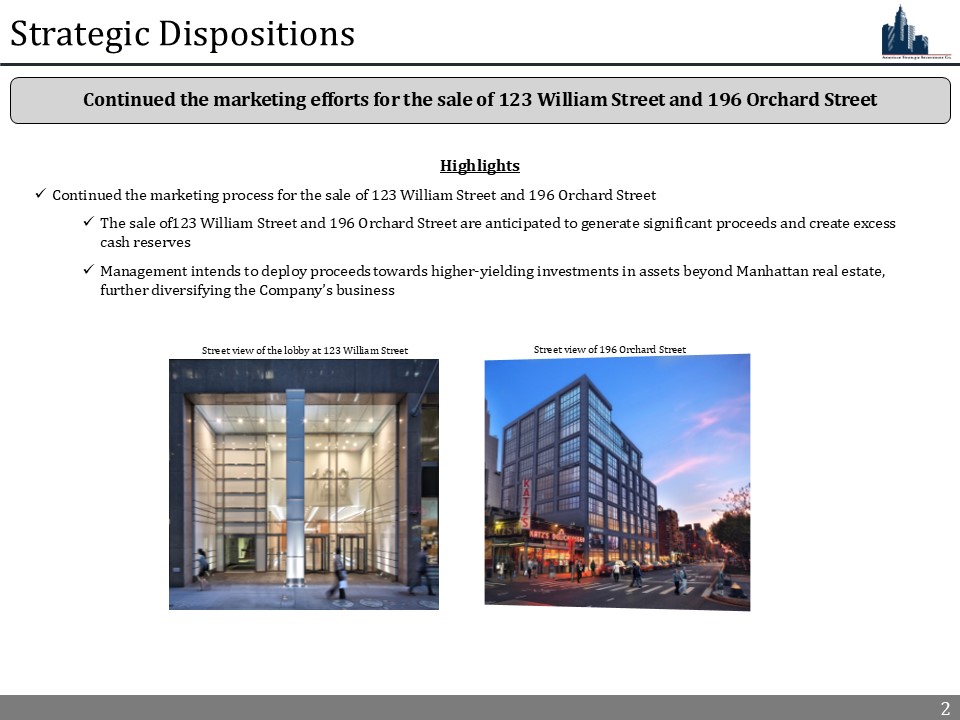
2 2 Continued the marketing efforts for the sale of 123 William Street and 196 Orchard Street Strategic Dispositions 2 Highlights x Continued the marketing process for the sale of 123 William Street and 196 Orchard Street x The sale of 123 William Street and 196 Orchard Street are anticipated to generate significant proceeds and create excess cash reserves x Management intends to deploy proceeds towards higher - yielding investments in assets beyond Manhattan real estate, further diversifying the Company’s business Street view of the lobby at 123 William Street Street view of 196 Orchard Street
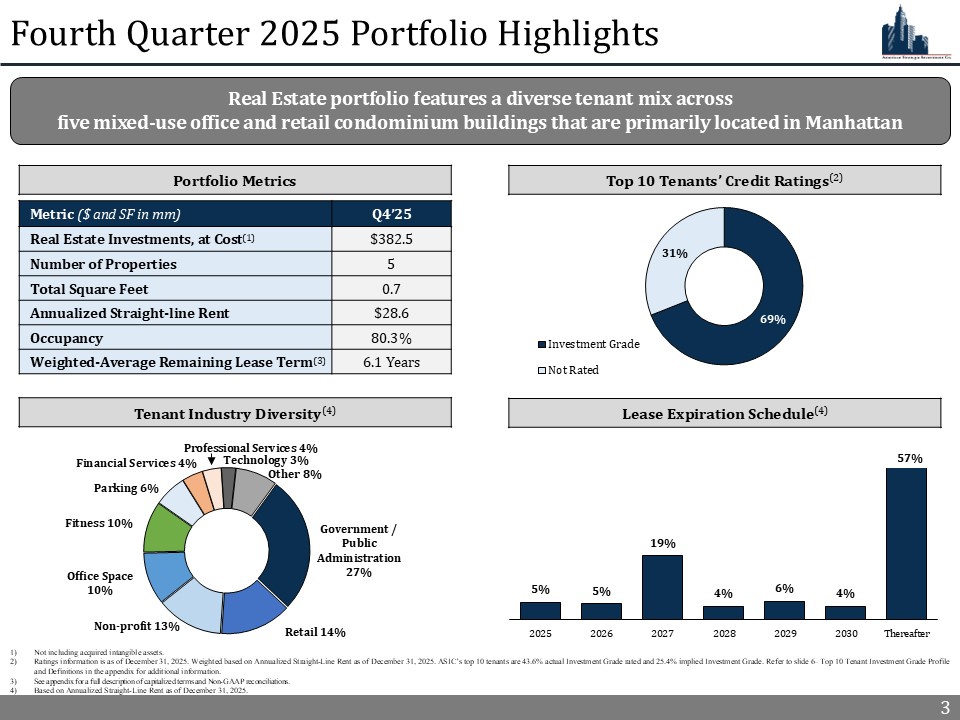
3 Fourth Quarter 2025 Portfolio Highlights Q4’25 Metric ($ and SF in mm) $382.5 Real Estate Investments, at Cost (1) 5 Number of Properties 0.7 Total Square Feet $28.6 Annualized Straight - line Rent 80.3% Occupancy 6.1 Years Weighted - Average Remaining Lease Term (3) 1) Not including acquired intangible assets. 2) Ratings information is as of December 31, 2025. Weighted based on Annualized Straight - Line Rent as of December 31, 2025. ASIC’s top 10 tenants are 43.6% actual Investment Grade rated and 25.4% implied Investment Grade. Refer to slide 6 – Top 10 Tenant Investment Grade Profile and Definitions in the appendix for additional information. 3) See appendix for a full description of capitalized terms and Non - GAAP reconciliations. 4) Based on Annualized Straight - Line Rent as of December 31, 2025. 3 Government / Public Administration 27% Retail 14% Non - profit 13% Office Space 10% Fitness 10% Parking 6% Financial Services 4% Professional Services 4% Technology 3% Other 8% Real Estate portfolio features a diverse tenant mix across five mixed - use office and retail condominium buildings that are primarily located in Manhattan Top 10 Tenants’ Credit Ratings (2) Tenant Industry Diversity (4) Lease Expiration Schedule (4) Portfolio Metrics 69% 31% Investment Grade Not Rated 5% 5% 19% 4% 6% 4% 2025 2026 2027 2028 2029 2030 Thereafter 57%
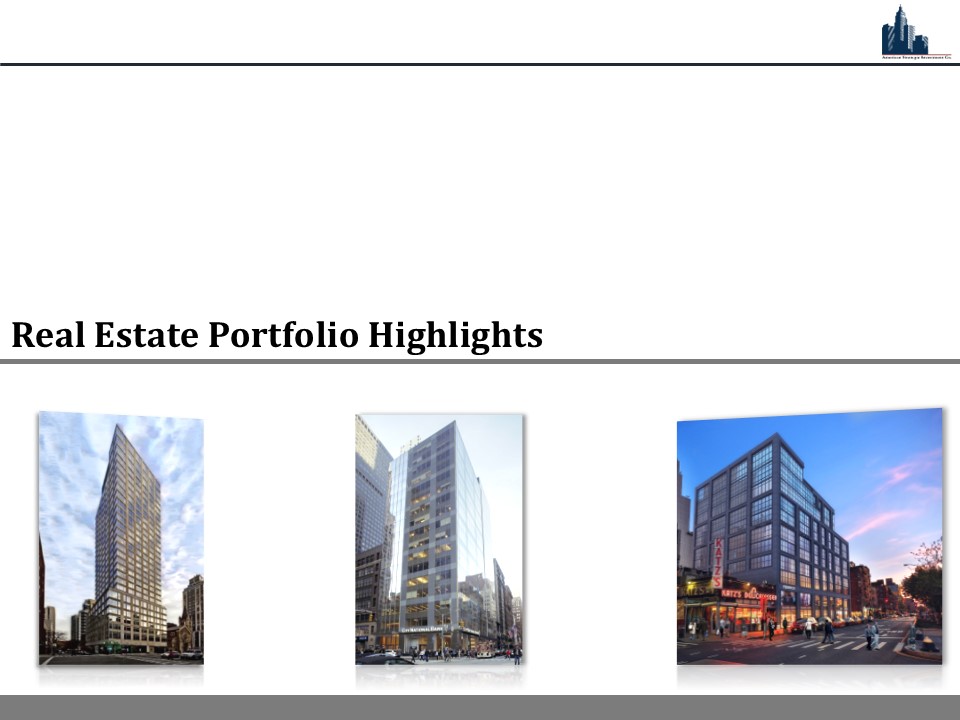
4 4 Real Estate Portfolio Highlights
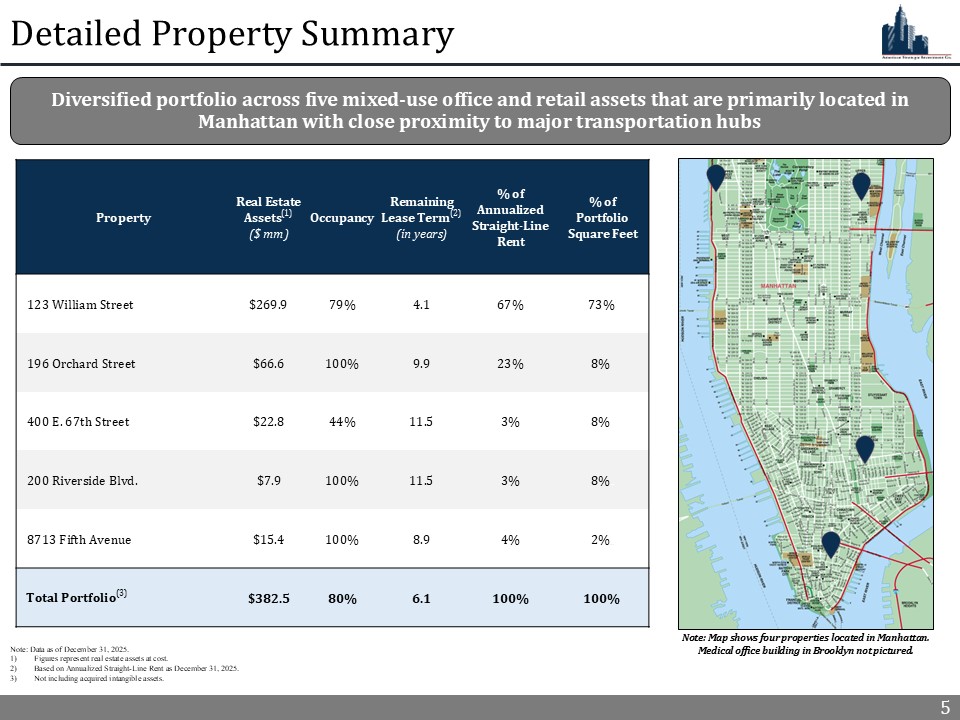
5 5 Detailed Property Summary Note: Data as of December 31, 2025. 1) Figures represent real estate assets at cost. 2) Based on Annualized Straight - Line Rent as December 31, 2025. 3) Not including acquired intangible assets. % of Portfolio Square Feet % of Annualized Straight - Line Rent Remaining Lease Term (2) (in years) Occupancy Real Estate Assets (1) ($ mm) Property 73% _ 67% 4.1 79% $269.9 123 William Street 8% _ 23% 9.9 100% $66.6 196 Orchard Street 8% _ 3% 11.5 44% $22.8 400 E. 67th Street 8% _ 3% 11.5 100% $7.9 200 Riverside Blvd. 2% _ 4% 8.9 100% $15.4 8713 Fifth Avenue 100% _ 100% 6.1 80% $382.5 Total Portfolio (3) Note: Map shows four properties located in Manhattan. Medical office building in Brooklyn not pictured. Diversified portfolio across five mixed - use office and retail assets that are primarily located in Manhattan with close proximity to major transportation hubs
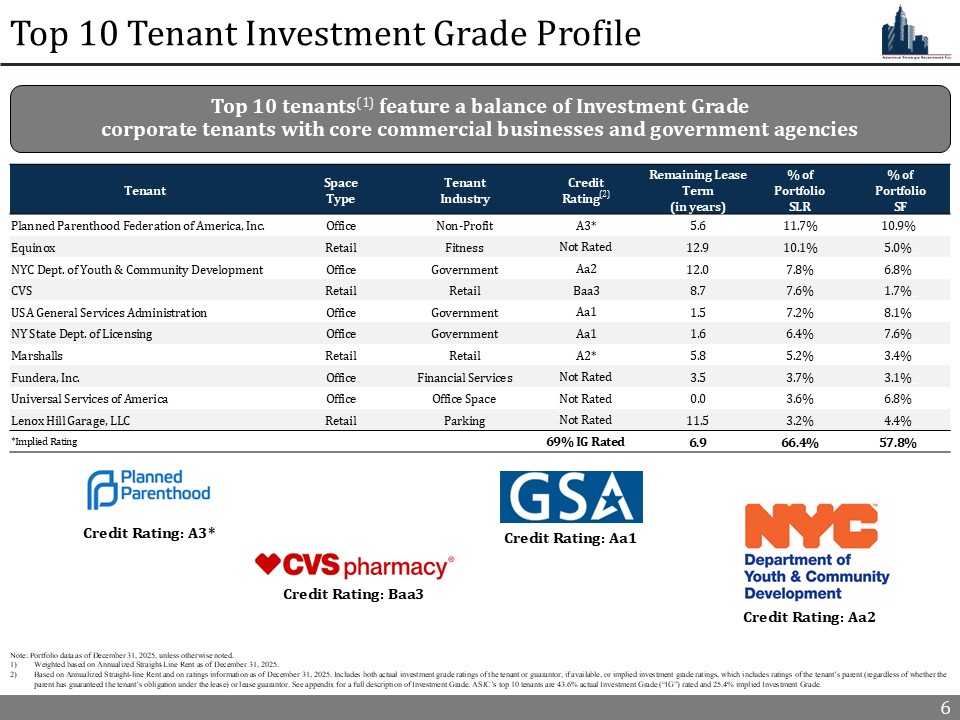
6 6 Note: Portfolio data as of December 31, 2025, unless otherwise noted. 1) Weighted based on Annualized Straight - Line Rent as of December 31, 2025. 2) Based on Annualized Straight - line Rent and on ratings information as of December 31, 2025. Includes both actual investment grade ratings of the tenant or guarantor, if available, or implied investment grade ratings, which includes ratings of the tenant’s p arent (regardless of whether the parent has guaranteed the tenant’s obligation under the lease) or lease guarantor. See appendix for a full description of Inv est ment Grade. ASIC’s top 10 tenants are 43.6% actual Investment Grade (“IG”) rated and 25.4% implied Investment Grade. Top 10 Tenant Investment Grade Profile % of Portfolio SF % of Portfolio SLR Remaining Lease Term (in years) Credit Rating (2) Tenant Industry Space Type Tenant 10.9% _ 11.7% 5.6 A3* Non - Profit Office Planned Parenthood Federation of America, Inc. 5.0% _ 10.1% 12.9 Not Rated Fitness Retail Equinox 6.8% _ 7.8% 12.0 Aa2 Government Office NYC Dept. of Youth & Community Development 1.7% _ 7.6% 8.7 Baa3 Retail Retail CVS 8.1% _ 7.2% 1.5 Aa1 Government Office USA General Services Administration 7.6% _ 6.4% 1.6 Aa1 Government Office NY State Dept. of Licensing 3.4% _ 5.2% 5.8 A2* Retail Retail Marshalls 3.1% _ 3.7% 3.5 Not Rated Financial Services Office Fundera , Inc. 6.8% _ 3.6% 0.0 Not Rated Office Space Office Universal Services of America 4.4% _ 3.2% 11.5 Not Rated Parking Retail Lenox Hill Garage, LLC 57.8% _ 66.4% 6.9 69% IG Rated *Implied Rating Credit Rating: A3* Credit Rating: Baa3 Credit Rating: Aa1 Credit Rating: Aa2 Top 10 tenants (1) feature a balance of Investment Grade corporate tenants with core commercial businesses and government agencies
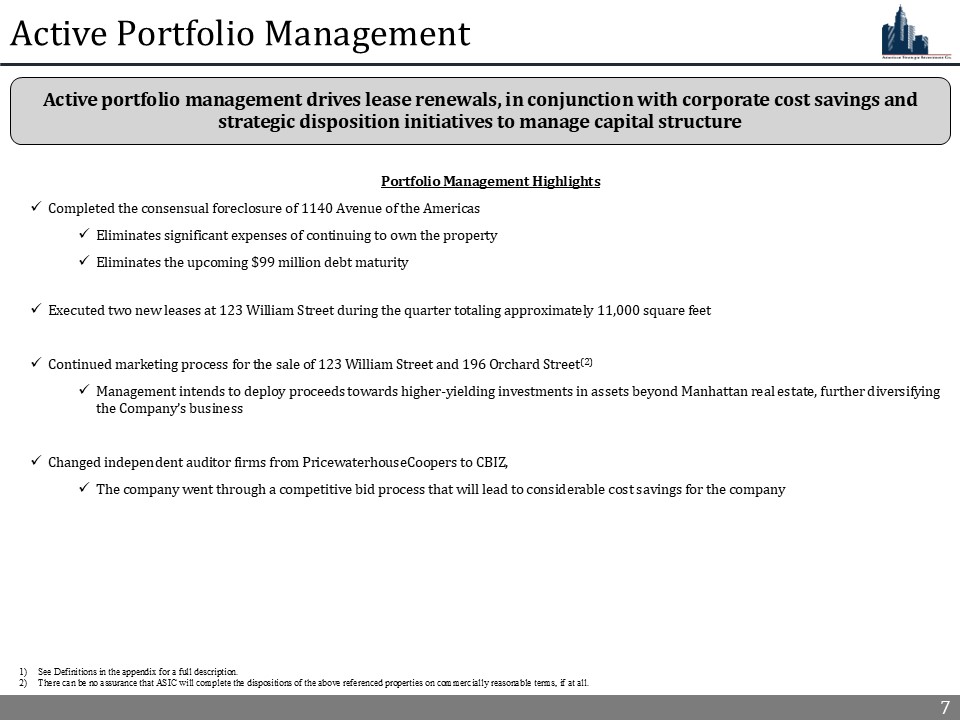
7 7 Active portfolio management drives lease renewals, in conjunction with corporate cost savings and strategic disposition initiatives to manage capital structure Active Portfolio Management 7 Portfolio Management Highlights x Completed the consensual foreclosure of 1140 Avenue of the Americas x Eliminates significant expenses of continuing to own the property x Eliminates the upcoming $99 million debt maturity x Executed two new leases at 123 William Street during the quarter totaling approximately 11,000 square feet x Continued marketing process for the sale of 123 William Street and 196 Orchard Street (2) x Management intends to deploy proceeds towards higher - yielding investments in assets beyond Manhattan real estate, further diversifying the Company’s business x Changed independent auditor firms from PricewaterhouseCoopers to CBIZ, x The company went through a competitive bid process that will lead to considerable cost savings for the company 1) See Definitions in the appendix for a full description. 2) There can be no assurance that ASIC will complete the dispositions of the above referenced properties on commercially reasona ble terms, if at all.
8 Financial Highlights
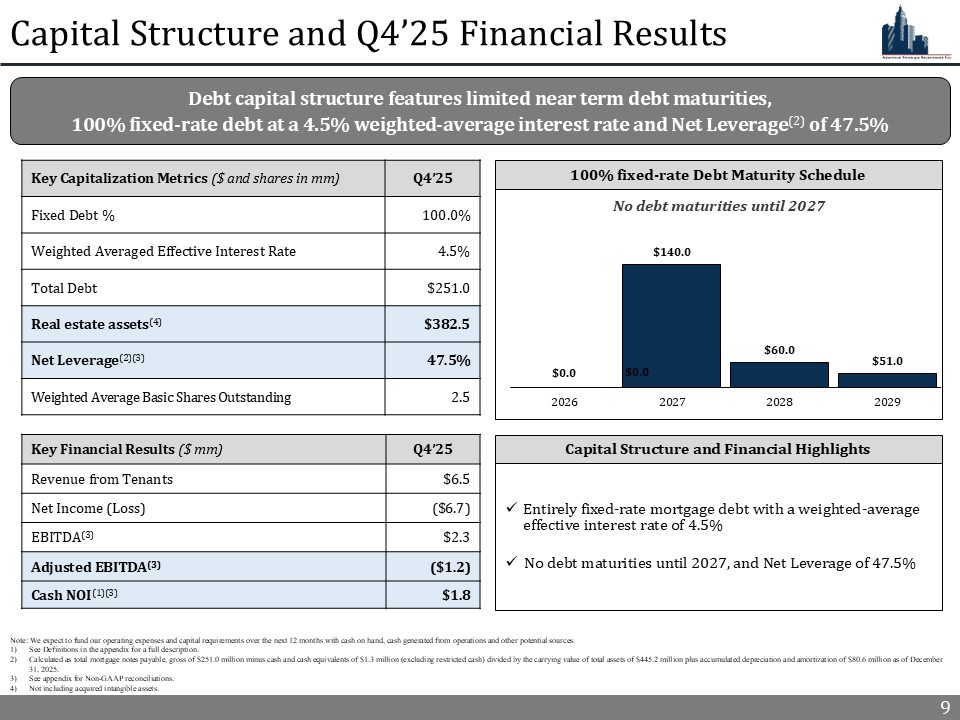
9 9 Capital Structure and Q4’25 Financial Results Note: We expect to fund our operating expenses and capital requirements over the next 12 months with cash on hand, cash gener ate d from operations and other potential sources. 1) See Definitions in the appendix for a full description. 2) Calculated as total mortgage notes payable, gross of $251.0 million minus cash and cash equivalents of $1.3 million (excludin g r estricted cash) divided by the carrying value of total assets of $445.2 million plus accumulated depreciation and amortizatio n o f $80.6 million as of December 31, 2025. 3) See appendix for Non - GAAP reconciliations. 4) Not including acquired intangible assets. Debt capital structure features limited near term debt maturities, 100% fixed - rate debt at a 4.5% weighted - average interest rate and Net Leverage (2) of 47.5% Q4’25 Key Capitalization Metrics ($ and shares in mm) 100.0% Fixed Debt % 4.5% Weighted Averaged Effective Interest Rate $251.0 Total Debt $382.5 Real estate assets (4) 47.5% Net Leverage (2)(3) 2.5 Weighted Average Basic Shares Outstanding 100 % fixed - rate Debt Maturity Schedule $140.0 $60.0 $51.0 $40.0 $60.0 $80.0 $100.0 $120.0 $140.0 $160.0 $180.0 2026 2027 2028 2029 $0.0 $0.0 Q4’25 Key Financial Results ($ mm) $6.5 Revenue from Tenants ($6.7) Net Income (Loss) $2.3 EBITDA (3) ($1.2) Adjusted EBITDA (3) $1.8 Cash NOI (1)(3) Capital Structure and Financial Highlights x Entirely fixed - rate mortgage debt with a weighted - average effective interest rate of 4.5% x No debt maturities until 2027, and Net Leverage of 47.5% No debt maturities until 2027
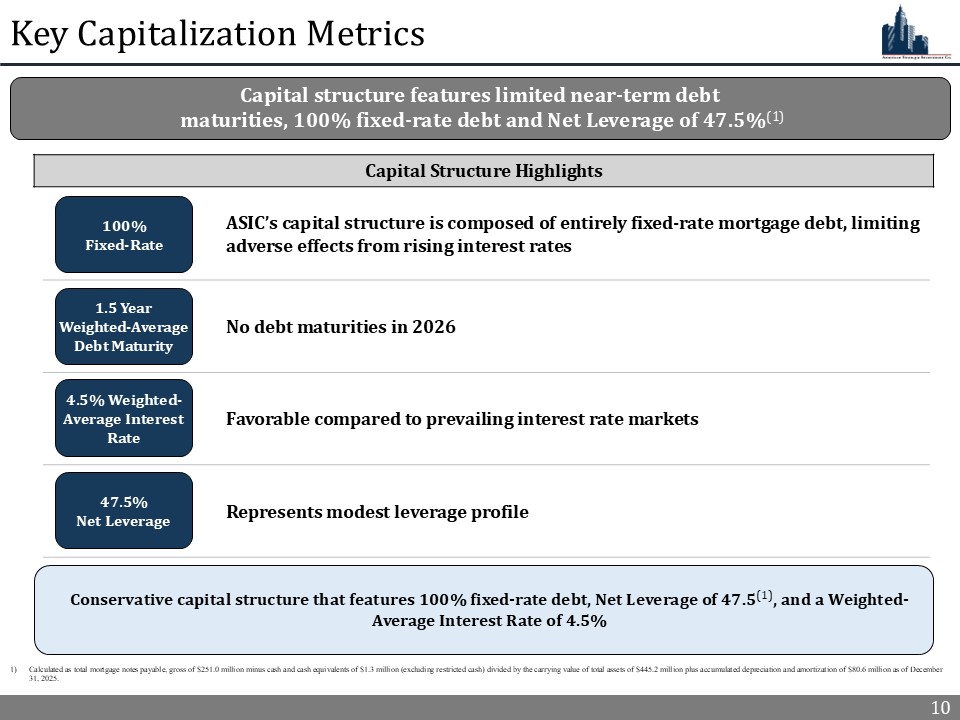
10 10 ASIC’s capital structure is composed of entirely fixed - rate mortgage debt, limiting adverse effects from rising interest rates No debt maturities in 2026 Favorable compared to prevailing interest rate markets Represents modest leverage profile Key Capitalization Metrics 10 Capital structure features limited near - term debt maturities, 100% fixed - rate debt and Net Leverage of 47.5% (1) Capital Structure Highlights 100% Fixed - Rate Conservative capital structure that features 100% fixed - rate debt, Net Leverage of 47.5 (1) , and a Weighted - Average Interest Rate of 4.5% 1.5 Year Weighted - Average Debt Maturity 4.5% Weighted - Average Interest Rate 47.5% Net Leverage 1) Calculated as total mortgage notes payable, gross of $251.0 million minus cash and cash equivalents of $1.3 million (excludin g r estricted cash) divided by the carrying value of total assets of $445.2 million plus accumulated depreciation and amortizatio n o f $80.6 million as of December 31, 2025.
11 11 Management and Board of Directors
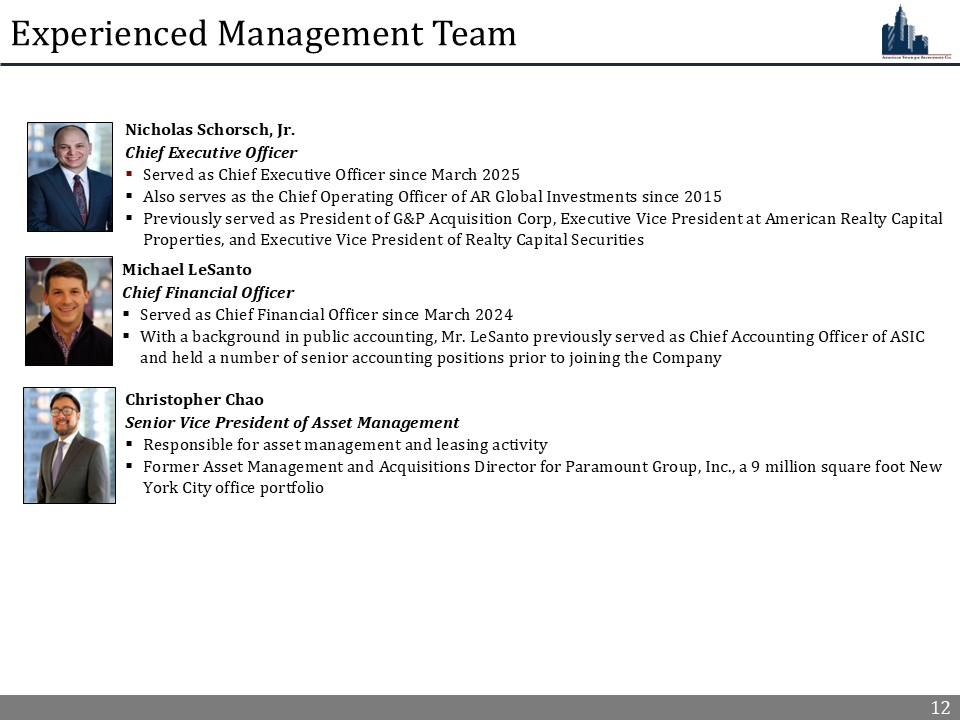
12 12 Experienced Management Team Christopher Chao Senior Vice President of Asset Management ▪ Responsible for asset management and leasing activity ▪ Former Asset Management and Acquisitions Director for Paramount Group, Inc., a 9 million square foot New York City office portfolio Michael LeSanto Chief Financial Officer ▪ Served as Chief Financial Officer since March 2024 ▪ With a background in public accounting, Mr. LeSanto previously served as Chief Accounting Officer of ASIC and held a number of senior accounting positions prior to joining the Company Nicholas Schorsch, Jr. Chief Executive Officer ▪ Served as Chief Executive Officer since March 2025 ▪ Also serves as the Chief Operating Officer of AR Global Investments since 2015 ▪ Previously served as President of G&P Acquisition Corp, Executive Vice President at American Realty Capital Properties, and Executive Vice President of Realty Capital Securities
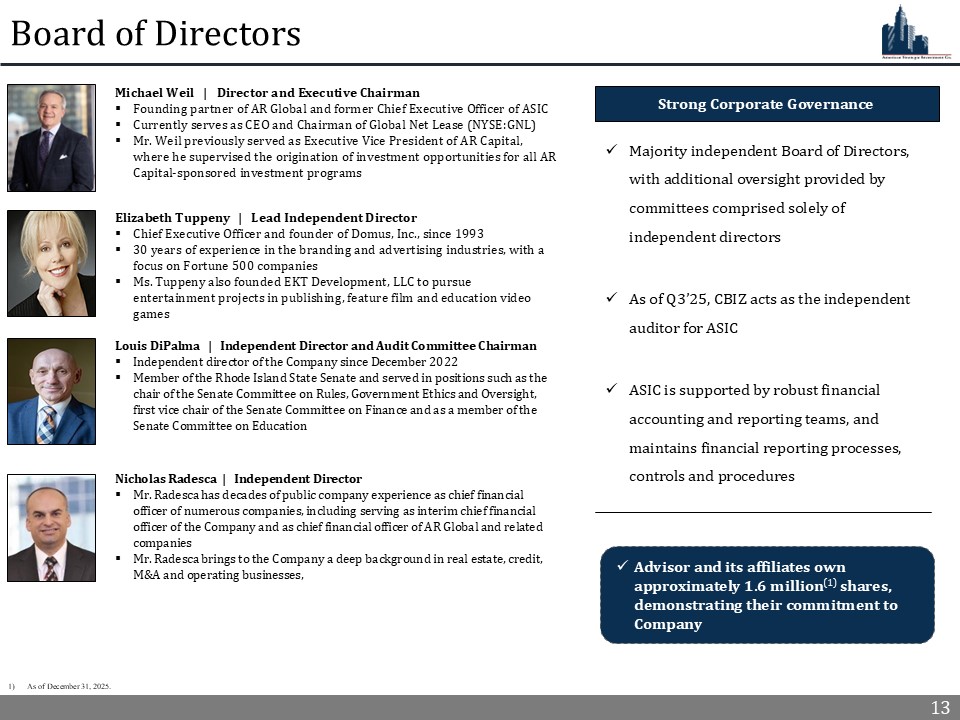
13 13 Board of Directors Michael Weil | Director and Executive Chairman ▪ Founding partner of AR Global and former Chief Executive Officer of ASIC ▪ Currently serves as CEO and Chairman of Global Net Lease (NYSE:GNL) ▪ Mr. Weil previously served as Executive Vice President of AR Capital, where he supervised the origination of investment opportunities for all AR Capital - sponsored investment programs Louis DiPalma | Independent Director and Audit Committee Chairman ▪ Independent director of the Company since December 2022 ▪ Member of the Rhode Island State Senate and served in positions such as the chair of the Senate Committee on Rules, Government Ethics and Oversight, first vice chair of the Senate Committee on Finance and as a member of the Senate Committee on Education Nicholas Radesca | Independent Director ▪ Mr. Radesca has decades of public company experience as chief financial officer of numerous companies, including serving as interim chief financial officer of the Company and as chief financial officer of AR Global and related companies ▪ Mr. Radesca brings to the Company a deep background in real estate, credit, M&A and operating businesses, Elizabeth Tuppeny | Lead Independent Director ▪ Chief Executive Officer and founder of Domus, Inc., since 1993 ▪ 30 years of experience in the branding and advertising industries, with a focus on Fortune 500 companies ▪ Ms. Tuppeny also founded EKT Development, LLC to pursue entertainment projects in publishing, feature film and education video games Strong Corporate Governance x Majority independent Board of Directors, with additional oversight provided by committees comprised solely of independent directors x As of Q3’25, CBIZ acts as the independent auditor for ASIC x ASIC is supported by robust financial accounting and reporting teams, and maintains financial reporting processes, controls and procedures x Advisor and its affiliates own approximately 1.6 million (1) shares, demonstrating their commitment to Company 1) As of December 31, 2025.

14 14 Appendix
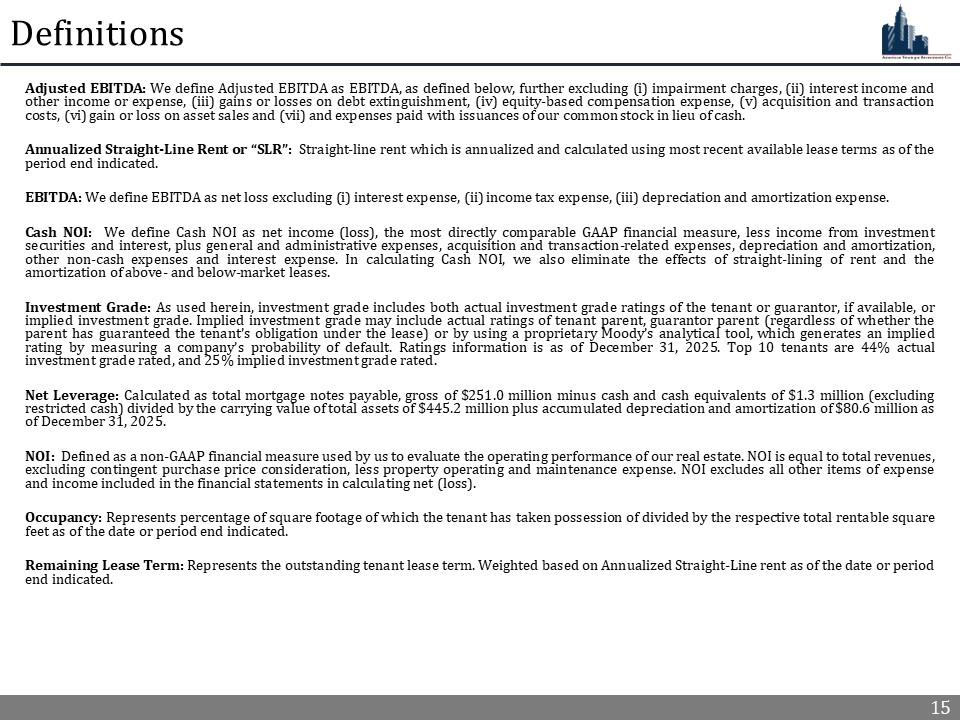
15 15 Definitions Adjusted EBITDA : We define Adjusted EBITDA as EBITDA, as defined below, further excluding ( i ) impairment charges, (ii) interest income and other income or expense, (iii) gains or losses on debt extinguishment, (iv) equity - based compensation expense, (v) acquisition and transaction costs, (vi) gain or loss on asset sales and (vii) and expenses paid with issuances of our common stock in lieu of cash . Annualized Straight - Line Rent or “SLR” : Straight - line rent which is annualized and calculated using most recent available lease terms as of the period end indicated . EBITDA : We define EBITDA as net loss excluding ( i ) interest expense, (ii) income tax expense, (iii) depreciation and amortization expense . Cash NOI : We define Cash NOI as net income (loss), the most directly comparable GAAP financial measure, less income from investment securities and interest, plus general and administrative expenses, acquisition and transaction - related expenses, depreciation and amortization, other non - cash expenses and interest expense . In calculating Cash NOI, we also eliminate the effects of straight - lining of rent and the amortization of above - and below - market leases . Investment Grade : As used herein, investment grade includes both actual investment grade ratings of the tenant or guarantor, if available, or implied investment grade . Implied investment grade may include actual ratings of tenant parent, guarantor parent (regardless of whether the parent has guaranteed the tenant’s obligation under the lease) or by using a proprietary Moody’s analytical tool, which generates an implied rating by measuring a company’s probability of default . Ratings information is as of December 31 , 2025 . Top 10 tenants are 44 % actual investment grade rated, and 25 % implied investment grade rated . Net Leverage : Calculated as total mortgage notes payable, gross of $ 251 . 0 million minus cash and cash equivalents of $ 1 . 3 million (excluding restricted cash) divided by the carrying value of total assets of $ 445 . 2 million plus accumulated depreciation and amortization of $ 80 . 6 million as of December 31 , 2025 . NOI : Defined as a non - GAAP financial measure used by us to evaluate the operating performance of our real estate . NOI is equal to total revenues, excluding contingent purchase price consideration, less property operating and maintenance expense . NOI excludes all other items of expense and income included in the financial statements in calculating net (loss) . Occupancy : Represents percentage of square footage of which the tenant has taken possession of divided by the respective total rentable square feet as of the date or period end indicated . Remaining Lease Term : Represents the outstanding tenant lease term . Weighted based on Annualized Straight - Line rent as of the date or period end indicated .
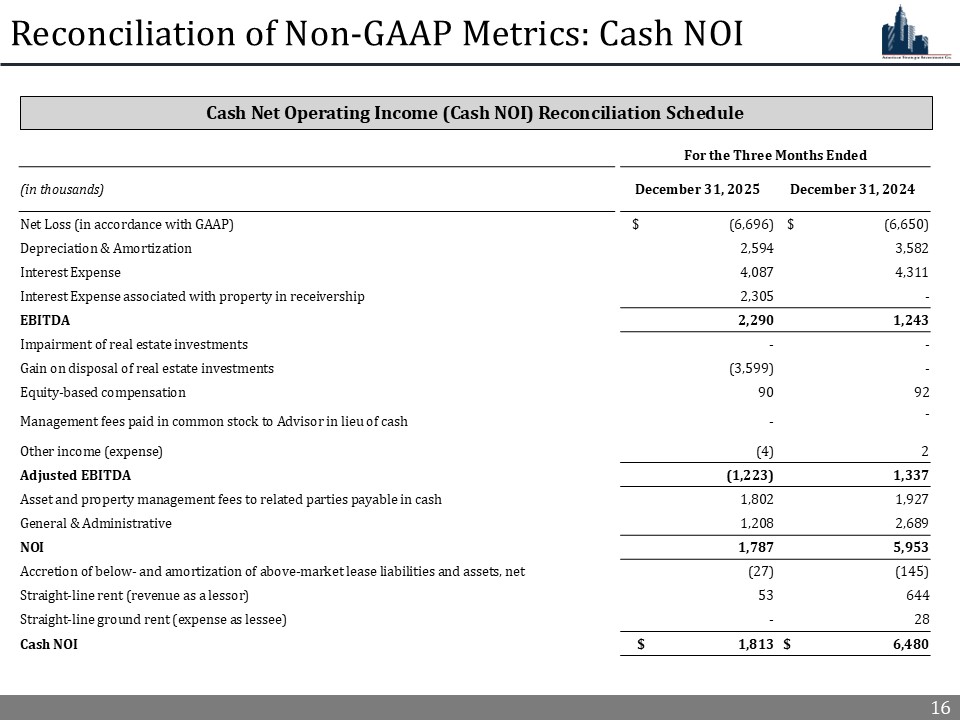
16 16 Reconciliation of Non - GAAP Metrics: Cash NOI For the Three Months Ended December 31, 2024 December 31, 2025 (in thousands) $ (6,650) $ (6,696) Net Loss (in accordance with GAAP) 3,582 2,594 Depreciation & Amortization 4,311 4,087 Interest Expense - 2,305 Interest Expense associated with property in receivership 1,243 2,290 EBITDA - - Impairment of real estate investments - (3,599) Gain on disposal of real estate investments 92 90 Equity - based compensation - - Management fees paid in common stock to Advisor in lieu of cash 2 (4) Other income (expense) 1,337 (1,223) Adjusted EBITDA 1,927 1,802 Asset and property management fees to related parties payable in cash 2,689 1,208 General & Administrative 5,953 1,787 NOI (145) (27) Accretion of below - and amortization of above - market lease liabilities and assets, net 644 53 Straight - line rent (revenue as a lessor) 28 - Straight - line ground rent (expense as lessee) $ 6,480 $ 1,813 Cash NOI Cash Net Operating Income (Cash NOI) Reconciliation Schedule
17 17 Legal Notices
18 18 Important Additional Information and Where to Find It References in this presentation to the “Company,” “we,” “us” and “our” refer to American Strategic Investment Co. (“ASIC”) an d i ts consolidated subsidiaries. This presentation contains estimates and information concerning the Company's industry that are based on industry publication s a nd reports. The Company has not independently verified the accuracy of the data contained in these industry publications and reports. Est ima tes and information in this presentation involve a number of assumptions and limitations, and you are cautioned not to rely on or giv e u ndue weight to this information. The industry in which we operate is subject to a high degree of uncertainty and risk due to variety of fact ors , including those described in the “Risk Factors” and “Management's Discussion and Analysis of Financial Condition and Results of Operations” s ect ions the Company’s Annual Report on Form 10 - K for the year ended December 31, 2025 filed on April 15, 2026 with the SEC, as such risks, u ncertainties and other important factors may be updated from time to time in the Company's subsequent reports. These and other factors cou ld cause results to differ materially from those expressed in these publications and reports. Non - GAAP Financial Measures We disclose certain non - GAAP financial measures we use to evaluate our performance, such as Cash Net Operating Income (“Cash NOI ”). A description of these non - GAAP measures and reconciliations to the most directly comparable GAAP measure, which is net income (lo ss), is provided on slide 16. None of these non - GAAP financial measures should be considered as a substitute for net income or any other financial measure presented in accordance with generally accepted accounting principles in the United States ("GAAP"). Because non - GAAP fi nancial measures are not standardized, such as Cash NOI, as defined by the Company, may not be comparable to similarly titled measure s r eported by other companies. It therefore may not be possible to compare the Company's use of these non - GAAP financial measures with those u sed by other companies. A reconciliation of all non - GAAP measures disclosed in this presentation to their nearest respective GAAP measu res can be found on slide 16 of this presentation. 18
19 19 Forward Looking Statements 19 This presentation does not constitute an offer to sell or a solicitation of an offer to purchase any securities of American S tra tegic Investment Co. (“We”, “us”, “our” or the “Company”). Any offer or sale of securities will be made only by means of a prospectus and related doc umentation meeting the requirements of the Securities Act of 1933, as amended, and no offer to sell or solicitation of an offer to buy s hal l be made in any jurisdiction in which such offer, solicitation or sale would be unlawful. This presentation contains statements that are not historical facts and may be forward - looking statements, including statements regarding the intent, belief or current expectations of us, our operating partnership and members of our management team, as well as the as sum ptions on which such statements are based, and generally are identified by the use of words such as “may,” “will,” “seeks,” “anticipate s,” “believes,” “estimates,” “projects,” “potential,” “predicts,” “expects,” “plans,” “intends,” “would,” “could,” “should” or similar expres sio ns are intended to identify forward - looking statements, although not all forward - looking statements contain these identifying words. Actual results may differ materially from those contemplated by such forward - looking statements. Further, forward - looking statements speak only as of the date they are made, and we undertake no obligation to update or revise forward - looking statements to reflect changed assumptions, the occu rrence of unanticipated events or changes to future operating results over time, unless required by law. These forward - looking statements are subject to a number of risks, uncertainties and other factors, many of which are outside of the Company’s control, which could cause actual results to differ materially from the results contemplated by the forward - looking statements. These risks and uncertainties include (a) the anticipated benefits of the Company's election to terminate its status as a real estate investm ent trust, (b) whether the Company will be able to successfully acquire new assets or businesses, (c) the potential adverse effects of the geopoliti cal instability due to the ongoing military conflicts between Russia and Ukraine, Israel and Hamas, and U.S. and Israel against Iran, including related sanctions and other penalties imposed by the U.S. and European Union, and the related impact on the Company, the Company's tenants, and the gl obal economy and financial markets, (d) inflationary conditions and higher interest rate environment, (e) economic uncertainties a bou t the ultimate impact of tariffs imposed by, or imposed on, the United States and its trading relationships, (f) that any potential future a cqu isition or disposition is subject to market conditions and capital availability and may not be identified or completed on favorable term s, or at all, and (g) that we may not be able to regain compliance with the New York Stock Exchange's (“NYSE”) continued listing requirements and r ule s, and the NYSE may delist the Company's common stock, which could negatively affect the Company, the price of the Company's common stoc k a nd shareholders' ability to sell the Company's common stock,, as well as those risks and uncertainties set forth in the Risk Fac tor s section of the Company’s Annual Report on Form 10 - K for the year ended December 31, 2025 filed on April 15, 2026, and all other filings with th e Securities and Exchange Commission after that date including but not limited to the subsequent Quarterly Reports on Form 10 - Q and Current R eports on Form 8 - K, as such risks, uncertainties and other important factors may be updated from time to time in the Company’s subsequent reports. Further, forward - looking statements speak only as of the date they are made, and the Company undertakes no obligation to update or revise any forward - looking statement to reflect changed assumptions, the occurrence of unanticipated events or changes to future operat ing results, unless required to do so by law.